Skip directly to content

Matt Fitzgerald's blog

Matt Fitzgerald's picture

Shark Week 2013 by the Numbers

on July 3, 2014 - 2:35pm

Because those who don't know their history are doomed to repeat #Megalodon, here are some of our favorite stats from Shark Week 2013.

Shark Week is Big, and Getting Bigger

2013 delivered the most watched Shark Week in Discovery Channel's history. Much like the ratings, online conversation about Shark Week has grown significantly every year. In other words...

To put those numbers in perspective, the infamous "Red Wedding" episode of Game of Thrones pulled in about 1.4 million tweets. Shark Week has formidable internet chops, er, chomps.

Tweeps <3 Sharks

Twitter is the most popular platform for Shark Week discussion, however the data is limited by Facebook's privacy settings (not that we're complaining about privacy). A simple search for Shark Week (and its variants) illustrates just how much conversation is being driven through the platform.

All-time "Shark Week" Tweets by Month

Since the dawn of Twitter the week has generated more than four million tweets about its name alone.

In 2013 each Shark Week show had its own hashtag. Below, you can see how the shows stacked up by mentions.

We have it on good sources that the not-so-good Shark After Dark live nightly talk show will return in 2014. For the record, we are big Bob the Shark fans. 

Shark Week is a Great Time for Shark-Saving

Even though the overall Shark Week conversation is growing like kudzu, the shark science and conservation conversation (represented below by Team Ocean) is actually growing faster. In fact...

With your help, we can keep that trend going and help connect shark fans with shark-saving action. 

If you're looking forward to this year's Shark Week, sign up to attend Upwell's third annual Sharkinar and get ready to save some sharks. 

Remember,

See you on Team Ocean!

Matt Fitzgerald's picture

A Social Labs Revolution in the Making

on March 21, 2014 - 5:01pm

Planning is killing us and prototyping will save us 
- that's the provocative premise of a new book from Zaid Hassan, cofounder of Reos, and host to a small but mighty group of activists, facilitators, designers and social entrepreneurs that I joined earlier this month for a workshop at the Lokey Graduate School of Business at Mills College. 

As a nonprofit consultant and participant in over a dozen strategic planning processes, I've seen the limitations of traditional planning approaches first-hand. The difficulties are confounded when the planning centers on navigating situations or challenges of complexity, where the actions undertaken will inevitably produce reactions from multiple stakeholders and result in a fundamentally new situation.

The startup community, by and large, gets this. The social sector - or at least the funding institutions within the social sector - mostly does not. 

For all the talk and activity around Lean Impact, most of the innovation-focussed philanthropic resources are still being passed out to plans constructed within a traditional planning paradigm. Even when the focus is on allegedly on the outcomes, the desire for accountability often results in the imposition of a planning methodology that values presumptive specificity over messy reality (#imho).

Furthermore, the societal challenges we face today are incredibly complex. From climate change to global poverty, from infectious diseases to cyber conflict, the world has never been more interconnected and never been more unsuited to taking on those challenges within a planning paradigm. What are some alternatives?

Hassan laid out a blueprint for what he calls Social Labs - interdisciplinary teams empowered to explore a portfolio of proposed solutions to a particular social or environmental challenge. They do this not by writing white papers or convening blue-ribbon panels, but rather by doing - by working to prototype the implementation of promising ideas in 30- or 60-day sprints.

Matt Fitzgerald's picture

What's In Your Bukkit? Bounding An Issue for Big Listening

on January 31, 2014 - 4:22pm

Here on the good ship Upwell we're often asked to help folks think through what Big Listening for their cause or issue might look like. This raises some intriguing questions about what their cause or issue is - what's in and what's out of their particular mental model for that thing. Call it a bukkit, m'kay?


What's in the LOLRUS's bukkit? Most likely bivalves.

Measuring something requires you to define it. The trick in measuring a conversation is that conversations change over time as participants engage in dialogue. And as conversations dynamically evolve over time, so too do the methods of expression (i.e. terminology, imagery, metaphors, etc.), the composition of participants, and the accompanying platforms. Much like species evolution, these changes are not always in a direction that we perceive to be fruitful. Evolution can lead to progress just as it can lead to dead-ends or fragmentation. Because of this, no conversational “listening” can ever be exhaustive (as some elements of the conversation will always be overlooked), nor can it be perfectly accurate (as noise will always creep in).

In bounding an issue for the purpose of (big) listening to it, we begin by developing a conceptual framework. For the purposes of explanation, let’s imagine our topic is marine debris a.k.a. trash in the ocean.

We would begin by outlining the conceptual and temporal boundaries of analysis for marine debris. The temporal aspect is important because a keyword group developed for one time period may lose significant accuracy (and utility) when applied to another period. For the conceptual outlines we often make use of a mind map such as the one for ocean acidification shown below.

For marine debris the concept map would include items such as marine trash, the pacific gyre, marine plastics, great pacific garbage patch, seaplex (minus exclusions for the botanical shampoo of the same name), albatross AND plastic.

Matt Fitzgerald's picture

Conversation Metrics for Overfishing and Sustainable Seafood

on February 28, 2013 - 6:25pm

The following post details before and after intervals in the two main conversations Upwell invested in: Sustainable Seafood and Overfishing. One finding of note is that both the Sustainable Seafood and Overfishing conversations have been substantially changed since the founding of Upwell. The narrative details significant increases in spike volume, spike frequency, and ratio of average daily social mentions to the average baseline (for more on how we quantify a baseline, see our baseline methodology. To understand how we quantify spikes, see our spike quantification methodology). 

Primary Campaign Topics: Then and Now

Sustainable Seafood

Comparison for Winter 2011 (top) and Winter 2012 (bottom) showing social mentions by day for Upwell’s Sustainable Seafood keyword group, as compared to the baseline, spike threshold and high spike threshold (Winter 2011: 10/17/2011 - 1/31/12; Winter 2012: 10/1/2012 - 1/29/13) 

In the Winter of 2011 (graph: above, top) when Upwell began Big Listening in Sustainable Seafood, social mention volume was an average of 423 mentions per day. By Winter of 2012 (graph: above, bottom), social mention volume had climbed to an average of 549 per day -- an increase of 29.9%. The ratio of average daily social mentions to the average baseline value also increased by 29.9% (as one would expect), going from 132.3% of the baseline in Winter 2011 to 171.8% of the baseline in Winter 2012. (Note: 'Average baseline' generalizes Upwell's day-of-the-week baseline values for a given topic into one mean value for the purpose of calculations, such as this one, which require a single value).

Spike frequency -- measured by how often social mention volume spikes equal to, or greater than Upwell’s spike threshold -- describes how often spikes occur, on average, in a particular conversation.

Matt Fitzgerald's picture

Upwell's Spike Quantification of the Ocean Conversation

on February 28, 2013 - 4:10pm

What is a Spike?

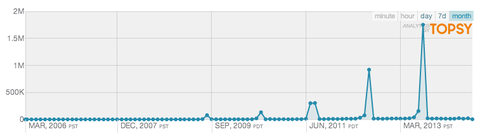
A spike is a significant increase in online attention for a particular topic. When you graph those social mentions, you can actually see that burst of attention ‘spike’ the graph -- hence the name. 

We have been observing spikes in the wild, so to speak, since the beginning of Upwell. It’s a concept that is at least somewhat familiar to anyone who has ever described a video as “viral,” or checked out the list of the most shared articles on The New York Times' website. A lot of people, sharing one thing, over a short time, creates a spike. In the world of Big Listening, that one thing they share can actually be a large number of different things on the same topic, but the general point remains the same. Surges in attention create spikes. So how do you measure one?

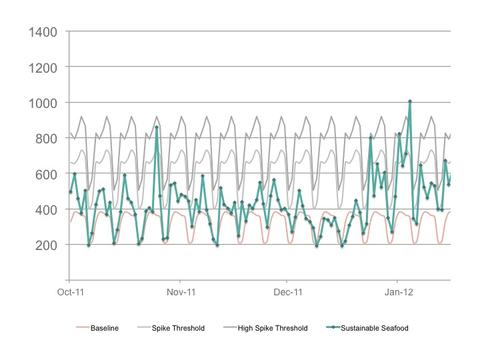
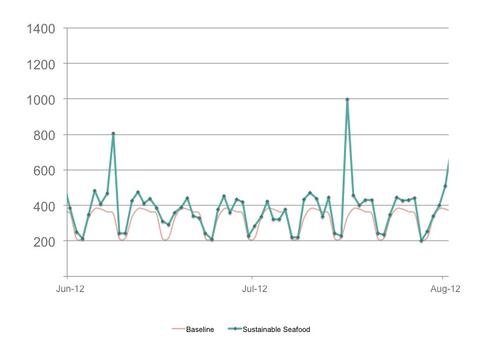
Let’s look at a graph of the sustainable seafood conversation from Summer 2012:

Social mentions for Upwell’s Sustainable Seafood keyword group vs. Upwell’s Sustainable Seafood Baseline, June 1, 2012 - August 1, 2012.

It seems pretty clear that there are two spikes in this time period. One appears on June 8, the other on June 16. But what about the other days? How far above the Baseline does social mention volume have to be in order to qualify as a spike? We set out to find a way to compare spikes that would answer the question.

Before we dive in, it’s important to note that social mention volume for a given day is a construct. We decided to use a day as the operating unit of time both because the tools we have available to us use that temporal distinction, and because a day as a unit of measurement is widely understood. That is not to say that one couldn’t decide to measure spikes by the hour, by the minute, or by some other amount of time. We made a conscious decision to build our initial definition of a spike around the day, but infinite other options exist as well. 

A second caveat is that focusing on spikes may obscure what is actually making up the long tail of post volume.

Matt Fitzgerald's picture

Upwell's Ocean Conversation Baseline Methodology

on February 28, 2013 - 2:49pm

What is a Baseline?

When Upwell says that we listen to the ocean conversation, what that means in practice is that we're conducting Big Listening on English-language conversations in the following eight "ocean conversation" topic areas: Overfishing, Sustainable Seafood, Marine Protected Areas (MPAs), Oceans (broadly defined), Cetaceans (whales and dolphins), Sharks, Tuna, Gulf of Mexico and Ocean Acidification. For each topic, both real-time and historical data provide essential context for understanding the volume, evolution and characteristics of the overall conversation.

Each topic we monitor is characterized and defined by a set of search terms (including exclusions) that we refine on an ongoing basis. While we recognize the limitations of “keyword groups,” such as their reliance on text-based results and the absence of  contextual awareness, they do provide a powerful tool for analyzing online attention. The development and active refinement of keyword groups is at the heart of Big Listening methodology.

We use Big Listening in order to:

  • identify and target high-value items for campaign purposes,
  • compare the relative size of different ocean sub issues (e.g. sharks vs. whales), and
  • measure the impact of our campaigns.

Since Upwell is a campaign agency (among other things), we needed a way to characterize these conversations as they exist, absent our interventions.

Enter the Baseline.

Baselines help us to anchor campaign performance targets in measures of past conversational volume. We set goals informed by the Baseline (as well as by spikes), and then campaign to meet and exceed those targets.

Upwell informally defines a conversation’s Baseline at the point below which the daily volume doesn’t drop. It can be thought of as a floor (although it is often quite high - in the tens of thousands for a conversation like Cetaceans), or as the number of social mentions performed each day by the topic’s diehard conversationalists.

Matt Fitzgerald's picture

Amplify Shark-saving Campaigns During Shark Week

on August 13, 2012 - 11:18am

Shark Week comes but once a year, but when it does, savvy ocean communicators seize the moment to ride the biggest online shark wave of the year. Here's a sample of how you can support and amplify shark conservationists and shark conservation campaigns this Shark Week. 

Know a campaign that should appear here? Send the info to our tips account and bask(ing shark) in your contributory glory!

Imagine Shark Week Without Great Whites

Great whites are to Shark Week what Usain Bolt is to the Olympics, what Val Kilmer is to ‘Tombstone’, what George Clooney is to ER reruns…. They are the charismatic big stars who at any moment can produce that moment of excitement. So try and imagine Shark Week without them.

As Oceana points out, “there might only be a few hundred adult great white sharks left off the Pacific coast of North America, and constant threats like fishing nets continue to kill baby white sharks in their nursery habitats.” That’s why Oceana is working with Discovery Channel gathering petitions in support of its campaign for great white sharks to be listed under the Endangered Species Act.

Amplify This:  Tweet this call for action to your supporters as a way to add more signatures to the petition.

Amplify This: Join the Shark Week Thunderclap and donate a facebook or twitter post for shark conservation. Add your voice at Thunderclap.it/SharkWeek.

Shark Fight: Shark Attack Survivors Fight for Conservation

Outside of events like Shark Week, it seems that sharks make the news a lot of the time only when one of them takes a bite out of a human diver or swimmer. For the humans involved, such attacks can be traumatic and debilitating, if not fatal. In the face of this challenge, however, an impressive and dedicated group of survivors is working with Pew Environment Group to press world leaders to act for shark conservation. So far, the survivors have been instrumental in persuading the U.S.

Matt Fitzgerald's picture

Shark Week Toolkit

on August 7, 2012 - 4:14pm

// This Toolkit is in progress. 
// Have suggestions for what should go in here?
// Get in touch

Welcome to your home for shark-saving resources to help you defend, protect and celebrate sharks online during Shark Week (starting Sunday, August 12 at 9pm ET)!

There's a lot in here, so we've packed all the action-y goodies at the top, and pushed the background information to the end. 

Table of Contents

I. Being a Super Engager

II. Background Information

 
This toolkit is a living, breathing thing, so please send us suggestions for additions and alterations. Also, let us know what this toolkit helps you do, and we'll repay the favor by driving more attention to your content!
 
Matt Fitzgerald's picture

Attention Lab Digest - Week of July 23

on July 27, 2012 - 5:45pm

With our intrepid Rachels on a Southern California sojourn down to visit our friends at One World One Ocean and the Waitt Foundation, Upwell’s Team Interns pulled on their red beenies and stepped up to the helm.

Can You Spot the Interns

Can you spot the interns?

Equally Evil Meets Socially Awesome, Again

Here at Upwell HQ we listen to and engage in online ocean conversations on a regular basis in order to amplify the best content and increase engagement. Since we happen to have some rather specialized tools at our disposal, we also jump in and do conversational analysis at times where we think we have something important to add.

A couple weeks ago we wanted to better understand the impact that the International Coral Reef Symposium (ICRS) had on the overall coral reef and ocean acidification conversations online. After doing a data dive, Aaron wrote a post, "Equally Evil = Socially Awesome," about differences in news media and social media coverage, as well as how the conference drove the biggest spikes in online mentions of coral and ocean acidification of 2012. 

We recently updated the data to reflect the post-ICRS conversation -- including subsequent commentary collected by Andy Revkin over at Dot Earth (here and here). Worth paying attention to, particularly for ocean communicators, is how the original Op/Ed fares in comparison to the subsequent contextualization and debate.  

Between July 13th and 20th, the "World Without Coral Reefs" Op/Ed received 1,384 online mentions. This is nearly exactly as many as Jane Lubchenco's "equally evil twin" quote received the week before (1,398), and a useful illustration of the "social liquidity" of emotional content. As is often the case online, controversy moved faster than context. 

Thanks to Living Oceans Foundation for helping us share the ICRS data dive on twitter.

Self-identified or aspiring #datanerd? Suit up and swim deeper into Aaron’s world, here.

London Calling.. Tuna

After the Nature Conservancy posted a slideshow of Olympic athletes versus

Matt Fitzgerald's picture

How To: Talk About Ocean Acidification in Public

on July 9, 2012 - 6:03pm

This post is part of the Attention Toolkit: Ocean Acidification


^ How are people talking about OA online these days? The wordcloud above was generated by our resident internet trawler-in-chief using cutting-edge tools so expensive they have their own car service.

Ocean acidification... just rolls right off the tongue, doesn’t it? We’ve perused the latest in OA opinion research to bring you some tips on how to communicate OA to regular humans. 

Without further ado:

The role of the living ocean is not well understood, so first lay the groundwork. 

The first step is to remind people of the functions of the ocean. The second is to introduce them to ocean acidification with a simple, “just the facts” definition of what ocean acidification is. 

Use pictures, analogies and local stories to establish the problem.

Introduce real live people, and their stories, to humanize and localize the issue. Stress that ocean acidification is happening now (not just in the future), and that is has measurable impacts. Bonus points if you can point to local impacts that affect your readers/audience personally.

For example:

The oyster industry in Oregon and Washington is worth $110 million a year and employs 3,200 people; if oysters are no longer able to form shells, that industry and those employees are affected.

The federal government is saying go ahead and drill off our coast,” said shellfish harvester Kevin Rhodes. “Ultimately, that’ll mean more emissions that will hurt us down the line. We can find another way to make energy. We can’t find another way to make fish.”

Remember that science is perceived as the credible voice on this issue.

Showcase the science, and scientists, but don’t go too far into the seaweeds. You can always link to another website or source for those who are interested. 

Activate your audience.

Whether folks are hearing about ocean acidification for the first time or are old hats, the scale and global nature of the problem can feel really

Pages