Add new comment
Upwell's Ocean Conversation Baseline Methodology
What is a Baseline?
When Upwell says that we listen to the ocean conversation, what that means in practice is that we're conducting Big Listening on English-language conversations in the following eight "ocean conversation" topic areas: Overfishing, Sustainable Seafood, Marine Protected Areas (MPAs), Oceans (broadly defined), Cetaceans (whales and dolphins), Sharks, Tuna, Gulf of Mexico and Ocean Acidification. For each topic, both real-time and historical data provide essential context for understanding the volume, evolution and characteristics of the overall conversation.
Each topic we monitor is characterized and defined by a set of search terms (including exclusions) that we refine on an ongoing basis. While we recognize the limitations of “keyword groups,” such as their reliance on text-based results and the absence of contextual awareness, they do provide a powerful tool for analyzing online attention. The development and active refinement of keyword groups is at the heart of Big Listening methodology.
We use Big Listening in order to:
- identify and target high-value items for campaign purposes,
- compare the relative size of different ocean sub issues (e.g. sharks vs. whales), and
- measure the impact of our campaigns.
Since Upwell is a campaign agency (among other things), we needed a way to characterize these conversations as they exist, absent our interventions.
Enter the Baseline.
Baselines help us to anchor campaign performance targets in measures of past conversational volume. We set goals informed by the Baseline (as well as by spikes), and then campaign to meet and exceed those targets.
Upwell informally defines a conversation’s Baseline at the point below which the daily volume doesn’t drop. It can be thought of as a floor (although it is often quite high - in the tens of thousands for a conversation like Cetaceans), or as the number of social mentions performed each day by the topic’s diehard conversationalists. If everyone else left the party, the Baseline would still be there, dancing by itself.

Robyn - euro popstar, solitary dancer, human Baseline metaphor
The Baseline: Up Close and Personal
Upwell’s Baseline methodology has evolved to capture the highly dynamic conversations we watch, especially cyclical variations by day of week. These cyclical variations often result from usage and posting patterns. For example, people tend to talk on the internet when they’re at work. Over the course of our pilot grant, Upwell has used three different version of baseline methodology to better measure the dynamic online conversation space:
- Baseline v1.0: The lowest level of daily social mentions for a given conversation, for a given period (implemented using Upwell topical keyword groups) [in use through late August 2012]
- Baseline v2.0: The median daily social mentions for a given conversation/keyword group for a given period [in use through mid-November 2012]
- Baseline v3.0: The average of the lowest 10% of social mention values for a topic on a given day of the week [in use through early January 2013]
- Baseline v3.1: The average of the lowest 20% of social mention values for a topic on a given day of the week [currently in use]
Our Baseline quantification methodology was created with input from leaders in the field including: K. D. Payne, Chairman & founder of Salience/ KDPaine & Partners, and co-author of the recently released Measuring The Networked Nonprofit; leading nonprofit technologist and Packard Fellow, Beth Kanter; and a senior Educational Policy Analyst for a leading national measurement/ social statistics firm contracted by the Gates Foundation, the Broad Foundation and the U.S. Department of Education.
To calculate the Baseline for a particular topic we begin by compiling all available social mention data for the period since we started monitoring it (mid-October 2011 or later, depending on the topic). We then disaggregate the data by the day of the week in order to deal with cyclical variations in post volume and compare Mondays to Mondays, and Sundays to Sundays. Once that’s done we calculate the average (mean) of the lowest 20% of values for each of the seven days. Taken together, those day-of-the-week values are what we refer to as the Baseline.
We selected the average (mean) to establish a specific value for each day of the week for three reasons. First, the mean is the starting point for calculating standard deviations used in our spike quantification methodology. Second, given the small size of most ocean conversations, the mean is the most typically consistent and available measurement when analyzing the conversation on a by day-of-the-week basis.
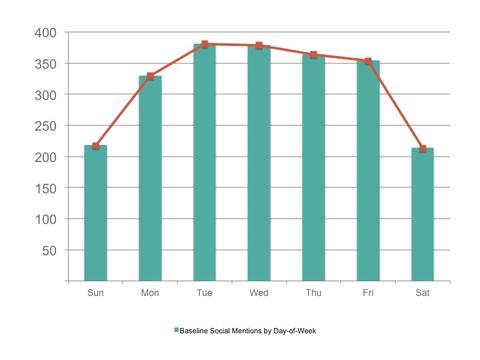
Baseline Social Mentions by Day-of-Week for Upwell’s Sustainable Seafood keyword group (10/17/11 - 1/29/13)
These daily Baseline values are then graphed against social mention data over time. The graph below shows the result.

Social mentions for Upwell’s Sustainable Seafood keyword group vs. Upwell’s Sustainable Seafood Baseline, June 1, 2012 - August 1, 2012
Context and Challenges for Baseline Quantification
As seen in the overfishing and sustainable seafood conversations, day-of-week periodicity is highly evident in social mention volume, largely driven by mention increases during U.S. working hours across Eastern to Pacific time zones, and with substantial drop offs on weekends. Using the current Baseline as a reference for setting campaign goals removes the disincentives present in previous Baseline quantifications to campaign on lower volume days, and gives a more accurate picture of success on all campaign days.
Our campaign efforts, along with unexpected conversational developments (think: the release of a new report or the arrival of a natural disaster) require us to add new terms to the relevant keyword group so that our work, or online mentions of some relevant, unanticipated development, is captured in our search terms. In the inevitable cases where we find noise in the results returned by particular terms (new and old), we respond by tightening or removing those terms from the keyword group.
Since keyword groups have keywords added and subtracted on an ongoing basis, there are some inherent challenges. How should Baseline calculations account for these changes? How and when should Baselines be refreshed? Should campaign targets be refreshed retrospectively? How should we treat a spike that loses or gains volume with a refreshed keyword group? Moving forward, Upwell will continue to drive innovations in our baseline methodology and in the integration of that methodology into our campaign process.
Finding the Baseline
Developing a Baseline for a topic or conversation requires an iterative process of definition, testing and measurement. And once you’ve got it, you have to refresh it to account for conversational evolutions. It’s like a marriage in that way, or so we’re told.
Measuring something requires you to define it. The trick in measuring a conversation is that conversations change over time as participants engage in dialogue. As conversations dynamically evolve over time, so too do the methods of expression (i.e. terminology, imagery, metaphors, etc.), the composition of participants, and the accompanying platforms. Much like species evolution, these changes are not always in a direction that we perceive to be fruitful. Evolution can lead to progress just as it can lead to dead-ends or fragmentation. Because of this, no conversational “listening” can ever be exhaustive (as some elements of the conversation will always be overlooked), nor can it be perfectly accurate (as noise will always creep in). This is why we continue to add and subtract terms to our Baseline keyword groups. Ongoing monitoring and modification of a Baseline keyword group is the most effective way to keep that keyword group refreshed and accurate. Since designing a keyword is as much about selective addition as selective omission, our ability to effectively evolve keywords and keyword groups is informed just as much by our listening practice with Radian6 as it is by our personal listening, professional network and subject matter expertise. No robot can do this, although some are trying, and interns probably can’t do it either.
In “baselining” a conversation, Upwell begins by developing a conceptual framework for the topic in question. For the purposes of explanation, let’s imagine our topic is Marine Debris. We would begin our Baseline development process by outlining the conceptual and temporal boundaries of analysis for marine debris. The temporal aspect is important because a keyword group developed for one time period may lose significant accuracy (and utility) when applied to another period. For the conceptual outlines we often make use of a mind map such as the one for Oceans shown partially below.
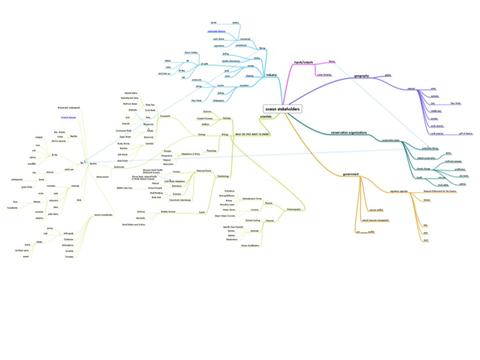
Upwell mind map for Oceans keywords, January 2012
For marine debris, the concept map would include items such as marine trash, the pacific gyre, marine plastics, great pacific garbage patch, seaplex (minus exclusions for the botanical shampoo of the same name), albatross AND plastic. The concept map would also include people, campaigns, expeditions and organizations such as Miriam Goldstein (a marine debris expert), The Trash Free Seas Alliance, the Plastiki, and Seaplex.
The concept map becomes a design artifact for further conversations about the conversation. Although we sometimes shortcut this process in the interests of time, we refine the map through a series of discussions and email exchanges with subject matter experts and knowledgeable people in the industry or industries at play.
Once we have a solid map of the conversation, we turn the map into a series of keywords. Keywords are textual search terms, much like something you might google. A keyword for Upwell, for example, would be “Upwell.” But it might also be a distinctive phrase (or fragment thereof) such as our tagline, “the ocean is our client.” A keyword, in this way, can actually be a number of elements (such as multiple words in a phrase) despite its singular form. This fact will become more important as we discuss more of those elements. A collection of keywords is called a keyword group, and search results for keyword groups are the foundational output of Big Listening.
A couple wrinkles make the construction of keywords and keyword groups significantly more challenging that one might expect. The first is noise. When you type something into a Google search bar and click on a result, you are deploying a potent combination of Google’s massive computational power, billions of dollars in said company’s algorithmic investments, and the concentrated smarts of your own interpretive brainpower. The last element is particularly important. Whereas Google displays dozens, if not thousands of search results for you to choose from -- and then asks you to filter those results-- the keyword queries we construct for Big Listening must be built so as to filter out as much noise as possible. To return to friend-of-Upwell Miriam Goldstein, mentioned above for her marine debris expertise, a well-constructed keyword group for that subject would probably not include her name as a standalone keyword -- the reason being that she talks about other, non-marine-debris subjects as well. Entering “Miriam Goldstein” as a keyword nets you any mention of her full name, whether that takes the shape of a blog post about ocean trash or a friend’s tweet referencing her attendance at a particularly yummy brunch meeting. What you leave out of a keyword or keyword group is as important as what you put in.
Pruning out extraneous results through proper keyword construction brings us to the second wrinkle: exclusions. Exclusions are also textual search terms, but their purpose is to filter out results that match their terms. Exclusions can be tied to specific keywords or to entire keyword groups. A well-constructed (or scoped) exclusion can be the difference between finding online mentions of sharks, the creatures, or finding online mentions of the San Jose Sharks, the hockey team, creatures of a different sort. Exclusions can filter out things beyond keywords (such as entire categories of website domains, particular geographies of origin, or what a computer determines to be a particular language) using a variety of tools used in Big Listening-- source filters, to give one example.
Another wrinkle in keyword construction is proximity. Proximity is not available in every tool that might be applied in a Big Listening process, but it is present in Radian6, our tool of choice at the moment. Proximity is a modifier that can be applied to two or more words in a keyword, say “marine” and “debris.” Proximity, denoted by “~”, tells the tool/service how close a set of words must be in order to return a match. Closeness basically means: how many other words come in between? If we were to set proximity to zero for “marine debris,” Radian6 would return only items that include that exact phrase. If we set proximity to three, for example, we might get results such as “marine layer clotted with debris.” That distinction becomes increasingly important when Radian6 scrapes long forum discussions, news articles, or blog posts in which a topic might be mentioned in an extremely peripheral manner. Proximity provides another tool to scope a given keyword and focus the results in a particular way.
Keyword development feeds into an ongoing measurement process of Scope / Test / Adapt / Share. The cycle is presented below.
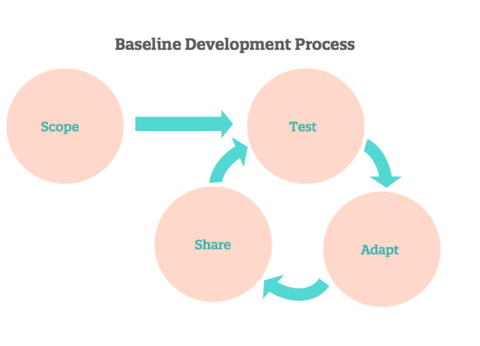
SCOPE
Initial investigation
1. Outline the conceptual and temporal boundaries of analysis for the topic
2. In consultation with subject-matter experts and other stakeholders, create a seed list of topics, subtopics, potential online influencers, and known online sources, events, and campaigns
TEST
Generating preliminary keywords
3. Use the seed list to develop initial keyword inputs for online search and social media monitoring services
4. Develop a more detailed set of keywords
5. Verify keyword accuracy and relevance using Radian6 to graph and spot-check search results, adding exclusion terms to filter extraneous results/noise, or various degrees of proximity to widen the net
ADAPT
Refining keyword groups
6. Share keyword lists with key informants (subject experts, foundation staff, campaigners etc.) and incorporate feedback (e.g., additional terms, scope adjustments)
7. Repeat steps 3, 4 and 5 with updated keywords
Cultivating and maintaining keywords
8. Campaign or otherwise monitor keyword group results on an ongoing basis
9. Update Baseline keyword groups with new inclusions and exclusions based on current events, campaigns and other developments (while always testing for the introduction of noise, per step 5)
10. On an as-needed basis, generally after at least three months of listening, share Baseline keyword groups with subject matter experts and other groups to gather feedback and potential improvements
SHARE
Exporting and preparing data
11. On a monthly, quarterly or to-order basis, export Big Listening data based on the most current keyword groups
12. Recalculate Baseline values
13. Graph and annotate charts with spike identifications
Packaging and distributing insights
14. Create reports, blog posts and other types of synthesis for external audiences
Improving the methodology
15. Gather feedback and process what we’ve discovered
16. Iterate our overall set of procedures
A crucial detail of the final stage of this process is the fact that exporting the data freezes it in time. To offer a contemporary example, all of the data in this report was current as of the end of January 2013, and then it was frozen in a spreadsheet. It’s important to remember that the conversations we monitor continue to change, even as we’re measuring and reporting on them.
Because the exported data is a snapshot of results for a particular conversation’s keyword group, as it existed at a particular time (of export), from a particular tool (or combination of tools), the resulting values cannot and should not be separated from the keyword group that produced them. Furthermore, due to the item volume returned by some of some of the larger keyword groups, exporting data will sometimes produce variations in measurements for the same hour, day or time period. This variation is due to the tools we use and is generally extremely small given the scale of the topics we’re monitoring. These two factors combine to reinforce our belief that Big Listening data can only be fully interpreted if the underlying keywords are available -- anything less is a black box
***
We've spent the last six weeks reflecting on our pilot project, and want to share our results with you. This post is one in a series of pieces about what we've learned over the last 10 months.
If you like this post check out:
Upwell's Spike Quantification of the Ocean Conversation
Upwell's Distributed Network Campaigning Method
Conversation Metrics for Overfishing and Sustainable Seafood