Conversation Metrics for Overfishing and Sustainable Seafood
The following post details before and after intervals in the two main conversations Upwell invested in: Sustainable Seafood and Overfishing. One finding of note is that both the Sustainable Seafood and Overfishing conversations have been substantially changed since the founding of Upwell. The narrative details significant increases in spike volume, spike frequency, and ratio of average daily social mentions to the average baseline (for more on how we quantify a baseline, see our baseline methodology. To understand how we quantify spikes, see our spike quantification methodology).
Primary Campaign Topics: Then and Now
Sustainable Seafood
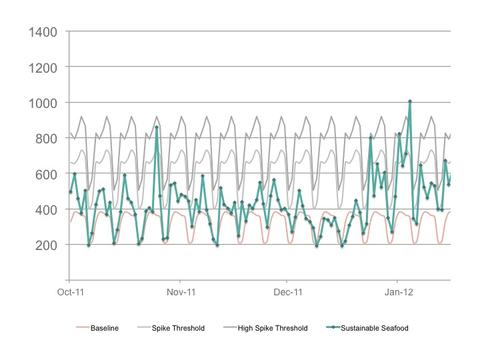
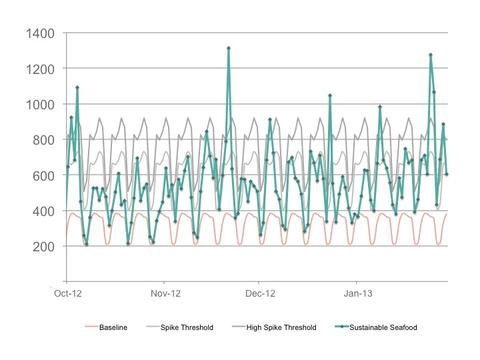
Comparison for Winter 2011 (top) and Winter 2012 (bottom) showing social mentions by day for Upwell’s Sustainable Seafood keyword group, as compared to the baseline, spike threshold and high spike threshold (Winter 2011: 10/17/2011 - 1/31/12; Winter 2012: 10/1/2012 - 1/29/13)
In the Winter of 2011 (graph: above, top) when Upwell began Big Listening in Sustainable Seafood, social mention volume was an average of 423 mentions per day. By Winter of 2012 (graph: above, bottom), social mention volume had climbed to an average of 549 per day -- an increase of 29.9%. The ratio of average daily social mentions to the average baseline value also increased by 29.9% (as one would expect), going from 132.3% of the baseline in Winter 2011 to 171.8% of the baseline in Winter 2012. (Note: 'Average baseline' generalizes Upwell's day-of-the-week baseline values for a given topic into one mean value for the purpose of calculations, such as this one, which require a single value).
Spike frequency -- measured by how often social mention volume spikes equal to, or greater than Upwell’s spike threshold -- describes how often spikes occur, on average, in a particular conversation. Spike frequency in the Sustainable Seafood conversation increased from 2.2 spikes every thirty days in Winter 2011, to 8.2 spikes every thirty days in Winter 2012 -- an increase of 265%. (Note: you can learn more about the spike threshold in this post).
Those spikes were not just occurring more often, they were also getting bigger. Upwell’s high spike threshold, set at two standard deviations above the average social mention volume for that day of the week, provides another indication of spike intensity. The more spikes reach the high threshold, the more the conversation is spiking at higher volumes. In Winter 2011, there were two high threshold spikes and the following year there were thirteen -- an average of 0.5 spikes per thirty days versus an average of 3.2 spikes per thirty days, a 475% increase.
Overfishing
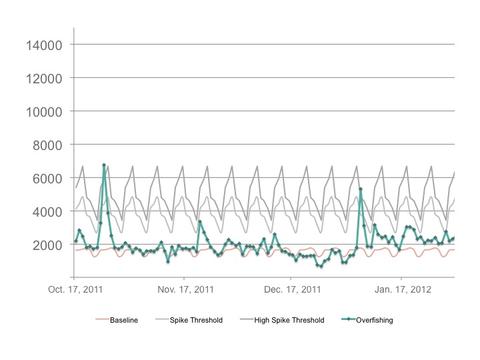
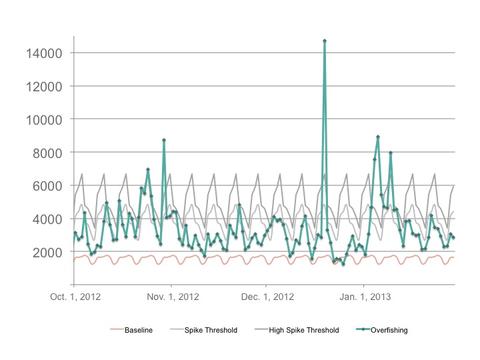
Comparison for Winter 2011 (top) and Winter 2012 (bottom) showing social mentions by day for Upwell’s Overfishing keyword group, as compared to the baseline, spike threshold and high spike threshold (Winter 2011: 10/17/2011 - 1/31/12; Winter 2012: 10/1/2012 - 1/29/13)
In the Winter of 2011 (graph: above, top) when Upwell began Big Listening in Overfishing, social mention volume was an average of 1,979 mentions per day. By Winter of 2012 (graph: above, bottom), social mention volume had climbed to an average of 3,386 per day -- a 71% increase. The ratio of average daily social mentions to the average baseline value also rose, from 126.5% of the baseline in Winter 2011, to 216.3% of the baseline in Winter 2012. (Note: average baseline, as above).
Spike frequency -- measured by how often social mention volume spikes equal to or greater than Upwell’s spike threshold -- describes how often spikes occur, on average, in a particular conversation. Spike frequency in the Overfishing conversation increased from 0.8 spikes every thirty days in Winter 2011, to 7.4 spikes every thirty days in Winter 2012 -- a massive increase of 784%. The 30-day rate of high threshold spikes also increased, from an average of 0.6 to an average of 3.2 -- a 475% increase.
(Notes: Upwell defintes high threshold spikes as occurring when social mention volume for a given day is greater-than or equal-to two standard deviations above the average social mention volume for that day of the week. You can learn more about the spike threshold in this post).
***
We've spent the last six weeks reflecting on our pilot project, and want to share our results with you. This post is one in a series of pieces about what we've learned over the last 10 months.
If you like this post check out:
Upwell's Ocean Conversation Baseline Methodology
Comments
Controls
It seems a bit arbitrary to attribute differences between two times to Upwell (sorry guys, you know I love you). How do you know there wasn't a particular event(s) that influenced the 2012 conversation, that would have meant spikes even in the absence of Upwell's efforts? It might be playing with fire, but I'd like to see a comparison between Upwell-enhanced events and similar events that Upwell did not cover.
Hi Miriam, that's a really
Hi Miriam, that's a really good point. We're not saying that we're responsible - just that we measured a change. We're putting up more pieces of our research and we'll be sure to provide more of that attribution and context wherever we can. Keep holding our feet to the underwater fire!
Add a comment